![]()
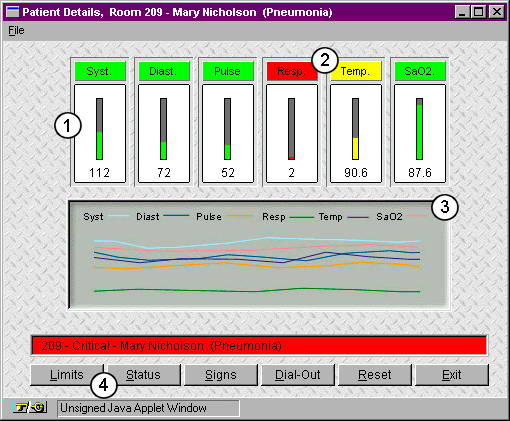
| To get an up-to-the-minute report on a single patient, simply touch his or her room on the hospital map, and this screen will appear. Each vital sign is displayed in both numerical and graphic form. Just as in the overview screen, color highlights any warning conditions (red for critical, yellow for warning, green for safety, and purple for off-line). Now even understaffed hospitals can respond to emergencies in seconds, knowing what to do before they reach the room. |

The systolic pressure gauge presents values using both numbers and bar graphs. As the monitored pressures change with time, the graphs will grow or shrink accordingly, and the numbers at the bottom of the faceplate will change to reflect the new values. Since the systolic pressure is within normal limits, it is colored green.
Colored icons for each vital sign describe current conditions. For example, in this screen, a critical reading for respiration rate has caused the Resp. icon to flash red.
A trend graph is shown below the current vital sign readings in order to help trend analysis and display historic vital sign readings (not functional in on-line demo).
The buttons along the bottom of the screen let you customize monitoring options for each patient, letting you change warning and critical limits, choose which signs are supervised and which aren't, alter external telecommunications, and account for such variables as age, mobility, and status (windows appear in on-line demo, but are not functional).
|Contents| |Solowatch Brochure| |Summary| |Goals| |Status|
|Brochure Contents| |Previous Page| |Next Page|